
Saturday, December 23, 2017
Monday, September 8, 2014
Week 2 Drive-Point Efficiency
As always, better is up and to the right. Teams with the highest efficiency ratings in both offense and defense will be in the upper right quadrant.

Friday, September 5, 2014
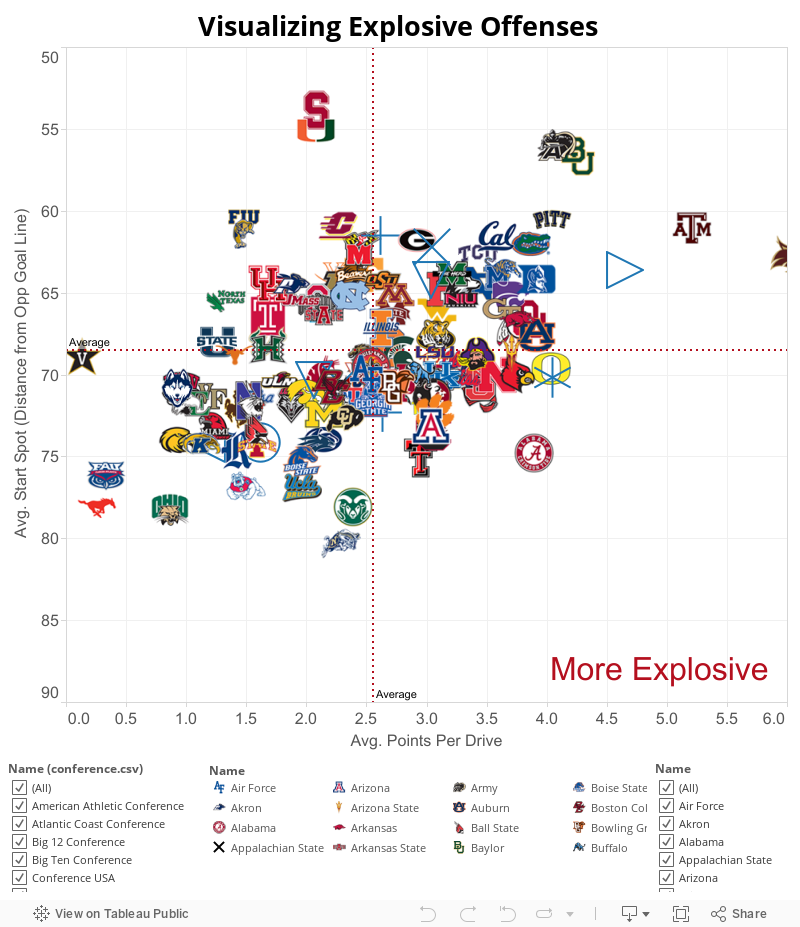
Visualizing Explosive Offenses
In his article "The five factors: College football's most important stats" Football Study Hall's Bill Connelly proposes that explosiveness was one of the most important statistics in college football. Connelly defined explosiveness as Equivalent Points per Play and showed how winning this battle was highly correlated to winning the game.
I think there is another way to look at explosiveness.
Charting average points per drive and average drive starting position yields a chart that illustrates the relationship between the two.
On the vertical (Y) axis I plotted Average Starting Position per Drive. This is the average distance from the opponent's goal line, so a smaller number is better.
On the horizontal (X) axis I plotted Average Points per Drive. For this measure, larger is of course better.
The quadrants can be interpreted this way: Teams in the lower right had, on average, further to go to score and averaged more points per drive than the rest of the FBS. Essentially, those teams did more with less and did it more frequently.
Teams in the upper left quadrant had a more favorable starting position but failed to capitalize on that advantage, scoring on average less points per drive than the FBS.
Teams in the upper right had better than average field position AND turned it into points. Your 70-80 point scoring explosions are probably located here. Teams in the lower left had worse than average starting field position and didn't score much either. Teams in these two quadrants essentially did what would be expected of them. They scored or didn't score based on their field position.
Ideally, teams would want to be in the upper right...scoring frequently because you won the field position battle is always preferable, but the lower right is good too as it means a team has the ability to eat up large chunks of yards quickly.
Wednesday, September 3, 2014
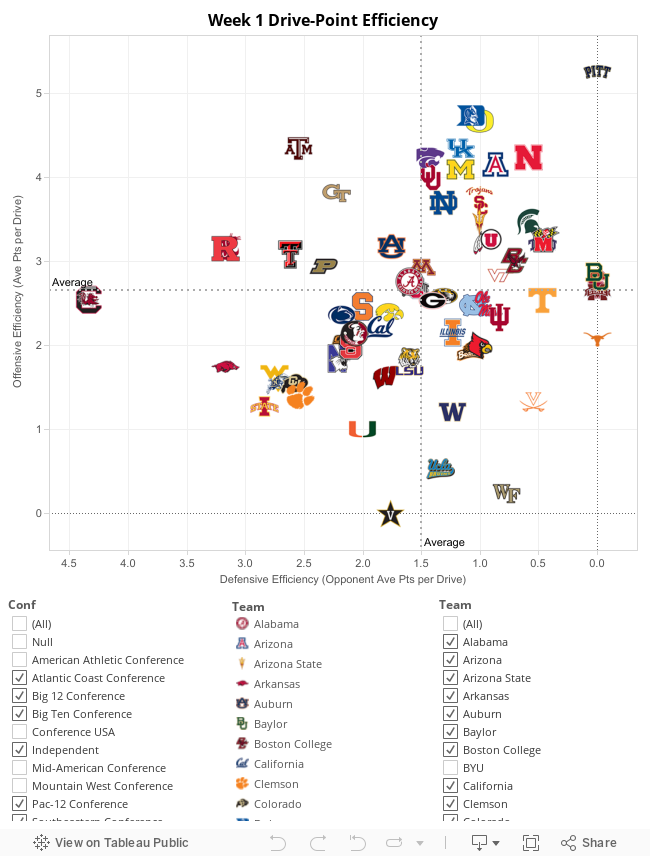
Week 1 Drive-Point Efficiency Report
Week 1 of the 2014 season is in the bag. It's still early, and there will be a lot more regressing to the mean happening in the next weeks as teams' statistical performances begin to more closely portray their true strengths. Until then, though, enjoy the wacky world of early season statistics.
Tuesday, February 11, 2014
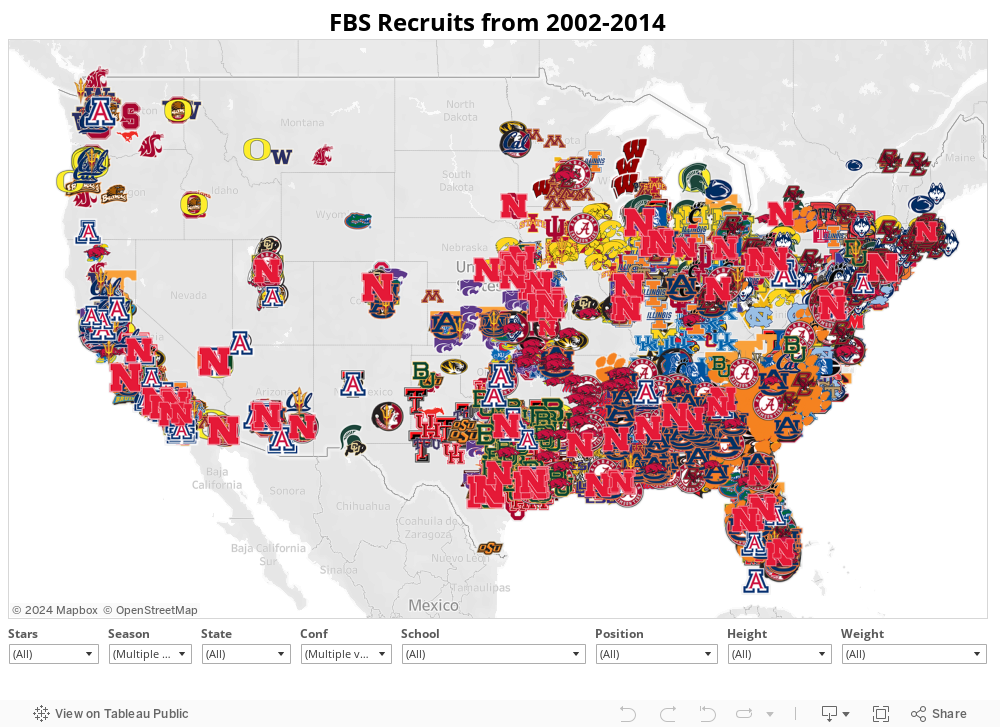
All FBS Recruits from 2002-2014
The map shows recruits for the last 4 years. Use the filters to make the map more usable.
The size of the logo corresponds to the number of stars given the recruit by Scout.com. I assigned 1 star to all unranked recruits...Scout.com does not identify recruits as less than 2 stars.
This visualization is copyrighted material. You're welcome to use it as you'd like, but please credit me, Paul Dalen, as the author and provide a link back to this blog.
Monday, October 21, 2013
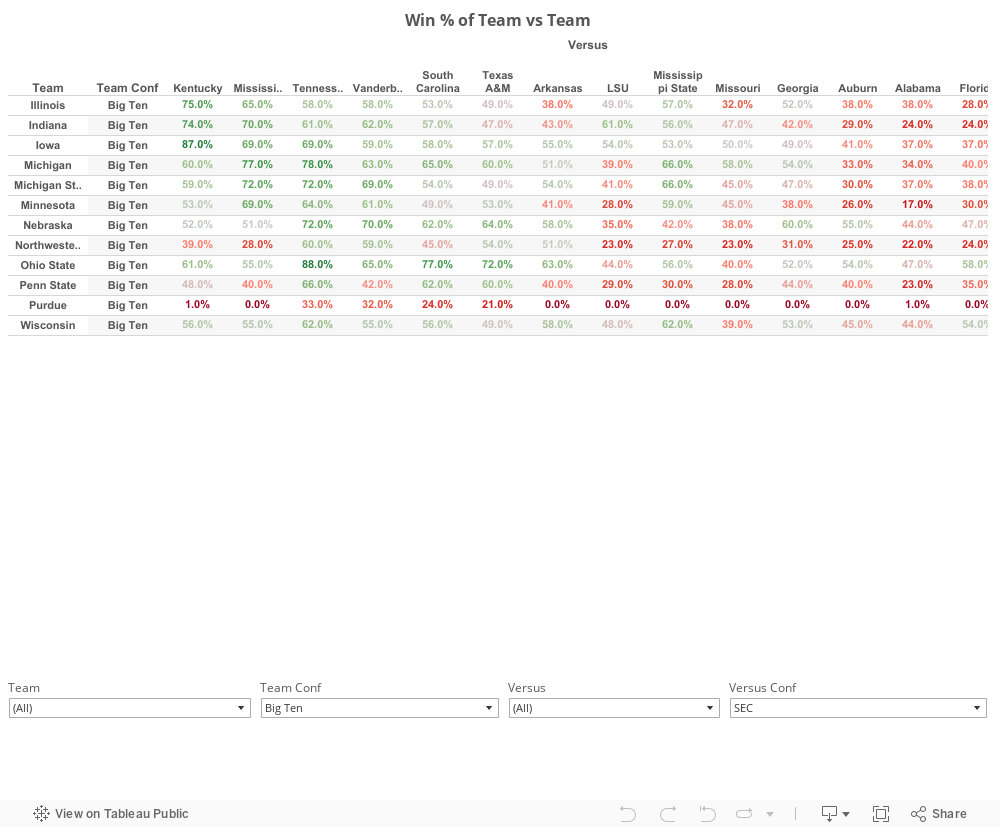
HuskerMath's FBS Power Ranking Win Percentage Matrix
Use the filters at the bottom to make the matrix a bit easier to handle, as well as easier to load.
Friday, April 12, 2013
Which Teams Overachieved and Which Teams Underachieved in 2012?
Tonight, while working putting together the final validation of the 2013 FBS Prediction Model, my analysis of the results highlighted some very interesting, and kind of disconcerting, things about Nebraska's 2012 season.
The model simulates every FBS game for the entire season.
As validation, I used the methodology to simulate the 2012 season and prepared a comparison between between the model results and the real game results.
This first chart shows some of those results of the predicted versus actual wins.
A positive number of the vertical axis means the model predicted more wins than a team achieved. Likewise, the negative numbers mean the model predicted fewer wins than the team achieved.

The average delta between the predicted win total and the actual win total is 1.15 games per team.
21% of teams were predicted correctly. 20% were under-predicted by one win, and 29% were over-predicted by one win. The model predicted more than 70% of seasons accurately to within one win.
The model under-predicted 12% of season by two wins and 5% by three wins. It over-predicted 7% over season by two wins and 6% of season by three wins.
Can you guess which team was the most over-achieving?
You betcha. Dear Old NU.
The model predicted 6.91 wins but the Huskers finished with 10 wins, for a delta of -3.09 wins.
While some may be inclined to see this as a positive, and it's certainly better than winning three fewer games than the model anticipated, the fact remains that Nebraska's scoring offense and scoring defense (the basis of the model) should have resulted in a 7-win season...not a 10-win season.
Remember the amazing streak of 4th quarter heroics in the Wisconsin, Northwestern, and Michigan State, and Penn State games? Remember how Denard Robinson left the game before halftime?
Sometimes, it's better to be lucky than good.
Interestingly, Ohio State is the #2 most overachieving team, with a predicted win total of 9.12. Had they played in the Big Ten Championship Game or a bowl game, they would almost certainly have been the most overachieving team by a large margin.
The Top-10 overachievers and Bottom-10 underachievers are:

So, can you guess which team had the largest standard deviation in the model results, and by proxy, was the least consistent and predictable?
Yup, Dear Old NU. Again.
Now, guess which team had the lowest standard deviation in model results.
Hint: they won the National Championship.
I'll let my readers draw their own conclusions about this one.
By the way, I'm now a writer over at Football Study Hall. Stop by and check it out. I'll be writing about more than just the Huskers over there.
GBR!
@HuskerMath
The model simulates every FBS game for the entire season.
As validation, I used the methodology to simulate the 2012 season and prepared a comparison between between the model results and the real game results.
This first chart shows some of those results of the predicted versus actual wins.
A positive number of the vertical axis means the model predicted more wins than a team achieved. Likewise, the negative numbers mean the model predicted fewer wins than the team achieved.

The average delta between the predicted win total and the actual win total is 1.15 games per team.
21% of teams were predicted correctly. 20% were under-predicted by one win, and 29% were over-predicted by one win. The model predicted more than 70% of seasons accurately to within one win.
The model under-predicted 12% of season by two wins and 5% by three wins. It over-predicted 7% over season by two wins and 6% of season by three wins.
Can you guess which team was the most over-achieving?
You betcha. Dear Old NU.
The model predicted 6.91 wins but the Huskers finished with 10 wins, for a delta of -3.09 wins.
While some may be inclined to see this as a positive, and it's certainly better than winning three fewer games than the model anticipated, the fact remains that Nebraska's scoring offense and scoring defense (the basis of the model) should have resulted in a 7-win season...not a 10-win season.
Remember the amazing streak of 4th quarter heroics in the Wisconsin, Northwestern, and Michigan State, and Penn State games? Remember how Denard Robinson left the game before halftime?
Sometimes, it's better to be lucky than good.
Interestingly, Ohio State is the #2 most overachieving team, with a predicted win total of 9.12. Had they played in the Big Ten Championship Game or a bowl game, they would almost certainly have been the most overachieving team by a large margin.
The Top-10 overachievers and Bottom-10 underachievers are:

I put a table with the full results of the model at the end of this post.
Finally, the model provides some insight into the consistency of a team's on-field performance. The standard deviation of the predicted wins can be used as a proxy for a team's consistency.
So, can you guess which team had the largest standard deviation in the model results, and by proxy, was the least consistent and predictable?
Yup, Dear Old NU. Again.
Now, guess which team had the lowest standard deviation in model results.
Hint: they won the National Championship.
I'll let my readers draw their own conclusions about this one.
By the way, I'm now a writer over at Football Study Hall. Stop by and check it out. I'll be writing about more than just the Huskers over there.
GBR!
@HuskerMath
| Rank | Team | Conf | Pred. Wins | Actual Wins | Delta (rnd) | Pred. Delta | Abs( Pred Delta) |
|---|---|---|---|---|---|---|---|
| 1 | Northern Illinois | MAC | 13.1 | 12 | 1 | 1.1 | 1.1 |
| 2 | Alabama | SEC | 12.7 | 13 | 0 | -0.3 | 0.3 |
| 3 | Florida State | ACC | 12.5 | 12 | 1 | 0.5 | 0.5 |
| 4 | Utah State | WAC | 11.2 | 11 | 0 | 0.2 | 0.2 |
| 5 | Oregon | Pac-12 | 11.0 | 12 | -1 | -1.0 | 1.0 |
| 6 | UCF | C-USA | 11.0 | 10 | 1 | 1.0 | 1.0 |
| 7 | Georgia | SEC | 10.9 | 12 | -1 | -1.1 | 1.1 |
| 8 | Boise State | MWC | 10.8 | 11 | 0 | -0.2 | 0.2 |
| 9 | Arizona State | Pac-12 | 10.7 | 8 | 3 | 2.7 | 2.7 |
| 10 | Cincinnati | Big East | 10.6 | 10 | 1 | 0.6 | 0.6 |
| 11 | Tulsa | C-USA | 10.5 | 11 | 0 | -0.5 | 0.5 |
| 12 | BYU | Ind | 10.5 | 8 | 2 | 2.5 | 2.5 |
| 13 | Texas A&M | SEC | 10.4 | 11 | -1 | -0.6 | 0.6 |
| 14 | Kansas State | Big 12 | 9.9 | 11 | -1 | -1.1 | 1.1 |
| 15 | North Carolina | ACC | 9.8 | 8 | 2 | 1.8 | 1.8 |
| 16 | Rutgers | Big East | 9.8 | 9 | 1 | 0.8 | 0.8 |
| 17 | Clemson | ACC | 9.8 | 11 | -1 | -1.2 | 1.2 |
| 18 | Oklahoma State | Big 12 | 9.8 | 8 | 2 | 1.8 | 1.8 |
| 19 | Bowling Green | MAC | 9.7 | 8 | 2 | 1.7 | 1.7 |
| 20 | Ohio | MAC | 9.7 | 9 | 1 | 0.7 | 0.7 |
| 21 | Vanderbilt | SEC | 9.7 | 9 | 1 | 0.7 | 0.7 |
| 22 | San Jose State | WAC | 9.6 | 11 | -1 | -1.4 | 1.4 |
| 23 | Fresno State | MWC | 9.6 | 9 | 1 | 0.6 | 0.6 |
| 24 | Stanford | Pac-12 | 9.6 | 12 | -2 | -2.4 | 2.4 |
| 25 | Kent State | MAC | 9.5 | 11 | -1 | -1.5 | 1.5 |
| 26 | Wisconsin | Big Ten | 9.4 | 8 | 1 | 1.4 | 1.4 |
| 27 | South Carolina | SEC | 9.2 | 11 | -2 | -1.8 | 1.8 |
| 28 | Notre Dame | Ind | 9.2 | 12 | -3 | -2.8 | 2.8 |
| 29 | Arkansas State | Sun Belt | 9.2 | 10 | -1 | -0.8 | 0.8 |
| 30 | Ohio State | Big Ten | 9.1 | 12 | -3 | -2.9 | 2.9 |
| 31 | San Diego State | MWC | 9.1 | 9 | 0 | 0.1 | 0.1 |
| 32 | Penn State | Big Ten | 8.8 | 8 | 1 | 0.8 | 0.8 |
| 33 | Florida | SEC | 8.7 | 11 | -2 | -2.3 | 2.3 |
| 34 | LSU | SEC | 8.7 | 10 | -1 | -1.3 | 1.3 |
| 35 | Oregon State | Pac-12 | 8.7 | 9 | 0 | -0.3 | 0.3 |
| 36 | Louisiana-Lafayette | Sun Belt | 8.6 | 9 | 0 | -0.4 | 0.4 |
| 37 | Northwestern | Big Ten | 8.6 | 10 | -1 | -1.4 | 1.4 |
| 38 | Oklahoma | Big 12 | 8.5 | 10 | -2 | -1.5 | 1.5 |
| 39 | Michigan | Big Ten | 8.3 | 8 | 0 | 0.3 | 0.3 |
| 40 | UCLA | Pac-12 | 8.2 | 9 | -1 | -0.8 | 0.8 |
| 41 | Louisiana-Monroe | Sun Belt | 8.2 | 8 | 0 | 0.2 | 0.2 |
| 42 | Pittsburgh | Big East | 8.1 | 6 | 2 | 2.1 | 2.1 |
| 43 | Western Kentucky | Sun Belt | 8.1 | 7 | 1 | 1.1 | 1.1 |
| 44 | Louisville | Big East | 8.1 | 11 | -3 | -2.9 | 2.9 |
| 45 | Mississippi State | SEC | 8.1 | 8 | 0 | 0.1 | 0.1 |
| 46 | Rice | C-USA | 7.9 | 7 | 1 | 0.9 | 0.9 |
| 47 | TCU | Big 12 | 7.8 | 7 | 1 | 0.8 | 0.8 |
| 48 | SMU | C-USA | 7.8 | 7 | 1 | 0.8 | 0.8 |
| 49 | Louisiana Tech | WAC | 7.7 | 9 | -1 | -1.3 | 1.3 |
| 50 | USC | Pac-12 | 7.7 | 7 | 1 | 0.7 | 0.7 |
| 51 | Nevada | MWC | 7.6 | 7 | 1 | 0.6 | 0.6 |
| 52 | Michigan State | Big Ten | 7.5 | 7 | 1 | 0.5 | 0.5 |
| 53 | Syracuse | Big East | 7.4 | 8 | -1 | -0.6 | 0.6 |
| 54 | North Carolina State | ACC | 7.4 | 7 | 0 | 0.4 | 0.4 |
| 55 | Toledo | MAC | 7.2 | 9 | -2 | -1.8 | 1.8 |
| 56 | East Carolina | C-USA | 7.2 | 8 | -1 | -0.8 | 0.8 |
| 57 | Navy | Ind | 7.2 | 8 | -1 | -0.8 | 0.8 |
| 58 | Air Force | MWC | 7.2 | 6 | 1 | 1.2 | 1.2 |
| 59 | Georgia Tech | ACC | 7.1 | 7 | 0 | 0.1 | 0.1 |
| 60 | Texas | Big 12 | 7.1 | 9 | -2 | -1.9 | 1.9 |
| 61 | Texas Tech | Big 12 | 7.0 | 8 | -1 | -1.0 | 1.0 |
| 62 | Nebraska | Big Ten | 6.9 | 10 | -3 | -3.1 | 3.1 |
| 63 | Western Michigan | MAC | 6.8 | 4 | 3 | 2.8 | 2.8 |
| 64 | UTSA | WAC | 6.6 | 8 | -1 | -1.4 | 1.4 |
| 65 | Central Michigan | MAC | 6.6 | 7 | 0 | -0.4 | 0.4 |
| 66 | New Mexico | MWC | 6.5 | 4 | 3 | 2.5 | 2.5 |
| 67 | Virginia Tech | ACC | 6.4 | 7 | -1 | -0.6 | 0.6 |
| 68 | Connecticut | Big East | 6.4 | 5 | 1 | 1.4 | 1.4 |
| 69 | Iowa State | Big 12 | 6.4 | 6 | 0 | 0.4 | 0.4 |
| 70 | Washington | Pac-12 | 6.3 | 7 | -1 | -0.7 | 0.7 |
| 71 | Middle Tennessee | Sun Belt | 6.3 | 8 | -2 | -1.7 | 1.7 |
| 72 | Ball State | MAC | 6.3 | 9 | -3 | -2.7 | 2.7 |
| 73 | Baylor | Big 12 | 6.2 | 8 | -2 | -1.8 | 1.8 |
| 74 | Mississippi | SEC | 6.2 | 7 | -1 | -0.8 | 0.8 |
| 75 | Minnesota | Big Ten | 6.2 | 6 | 0 | 0.2 | 0.2 |
| 76 | Troy | Sun Belt | 6.1 | 5 | 1 | 1.1 | 1.1 |
| 77 | Utah | Pac-12 | 6.1 | 5 | 1 | 1.1 | 1.1 |
| 78 | Memphis | C-USA | 5.9 | 4 | 2 | 1.9 | 1.9 |
| 79 | Iowa | Big Ten | 5.6 | 4 | 2 | 1.6 | 1.6 |
| 80 | Miami (Florida) | ACC | 5.4 | 7 | -2 | -1.6 | 1.6 |
| 81 | West Virginia | Big 12 | 5.3 | 7 | -2 | -1.7 | 1.7 |
| 82 | Purdue | Big Ten | 5.2 | 6 | -1 | -0.8 | 0.8 |
| 83 | Arizona | Pac-12 | 5.2 | 8 | -3 | -2.8 | 2.8 |
| 84 | Texas State | WAC | 5.1 | 4 | 1 | 1.1 | 1.1 |
| 85 | Houston | C-USA | 5.1 | 5 | 0 | 0.1 | 0.1 |
| 86 | Wyoming | MWC | 4.9 | 4 | 1 | 0.9 | 0.9 |
| 87 | South Alabama | Sun Belt | 4.8 | 2 | 3 | 2.8 | 2.8 |
| 88 | Marshall | C-USA | 4.8 | 5 | 0 | -0.2 | 0.2 |
| 89 | UNLV | MWC | 4.8 | 2 | 3 | 2.8 | 2.8 |
| 90 | Virginia | ACC | 4.8 | 4 | 1 | 0.8 | 0.8 |
| 91 | Maryland | ACC | 4.8 | 4 | 1 | 0.8 | 0.8 |
| 92 | North Texas | Sun Belt | 4.7 | 4 | 1 | 0.7 | 0.7 |
| 93 | Colorado State | MWC | 4.7 | 4 | 1 | 0.7 | 0.7 |
| 94 | Buffalo | MAC | 4.6 | 4 | 1 | 0.6 | 0.6 |
| 95 | Indiana | Big Ten | 4.5 | 4 | 0 | 0.5 | 0.5 |
| 96 | Tennessee | SEC | 4.4 | 5 | -1 | -0.6 | 0.6 |
| 97 | UTEP | C-USA | 4.4 | 3 | 1 | 1.4 | 1.4 |
| 98 | Florida International | Sun Belt | 4.3 | 3 | 1 | 1.3 | 1.3 |
| 99 | UAB | C-USA | 4.3 | 3 | 1 | 1.3 | 1.3 |
| 100 | Duke | ACC | 4.2 | 6 | -2 | -1.8 | 1.8 |
| 101 | Akron | MAC | 4.0 | 1 | 3 | 3.0 | 3.0 |
| 102 | Army | Ind | 4.0 | 2 | 2 | 2.0 | 2.0 |
| 103 | South Florida | Big East | 3.9 | 3 | 1 | 0.9 | 0.9 |
| 104 | Temple | Big East | 3.9 | 4 | 0 | -0.1 | 0.1 |
| 105 | Boston College | ACC | 3.8 | 2 | 2 | 1.8 | 1.8 |
| 106 | Florida Atlantic | Sun Belt | 3.8 | 3 | 1 | 0.8 | 0.8 |
| 107 | Missouri | SEC | 3.5 | 5 | -2 | -1.5 | 1.5 |
| 108 | Arkansas | SEC | 3.5 | 4 | -1 | -0.5 | 0.5 |
| 109 | Auburn | SEC | 3.4 | 3 | 0 | 0.4 | 0.4 |
| 110 | Wake Forest | ACC | 3.3 | 5 | -2 | -1.7 | 1.7 |
| 111 | Miami (Ohio) | MAC | 3.3 | 4 | -1 | -0.8 | 0.8 |
| 112 | Washington State | Pac-12 | 3.1 | 3 | 0 | 0.1 | 0.1 |
| 113 | California | Pac-12 | 2.8 | 3 | 0 | -0.2 | 0.2 |
| 114 | Hawaii | MWC | 2.7 | 3 | 0 | -0.3 | 0.3 |
| 115 | Kentucky | SEC | 2.5 | 2 | 1 | 0.5 | 0.5 |
| 116 | New Mexico State | WAC | 2.4 | 1 | 1 | 1.4 | 1.4 |
| 117 | Illinois | Big Ten | 2.4 | 2 | 0 | 0.4 | 0.4 |
| 118 | Eastern Michigan | MAC | 2.3 | 2 | 0 | 0.3 | 0.3 |
| 119 | Tulane | C-USA | 1.8 | 2 | 0 | -0.2 | 0.2 |
| 120 | Kansas | Big 12 | 1.8 | 1 | 1 | 0.8 | 0.8 |
| 121 | Southern Mississippi | C-USA | 1.7 | 0 | 2 | 1.7 | 1.7 |
| 122 | Idaho | WAC | 1.3 | 1 | 0 | 0.3 | 0.3 |
| 123 | Colorado | Pac-12 | 0.9 | 1 | 0 | -0.1 | 0.1 |
Subscribe to:
Posts (Atom)