
Monday, September 8, 2014
Week 2 Drive-Point Efficiency
As always, better is up and to the right. Teams with the highest efficiency ratings in both offense and defense will be in the upper right quadrant.
Friday, September 5, 2014
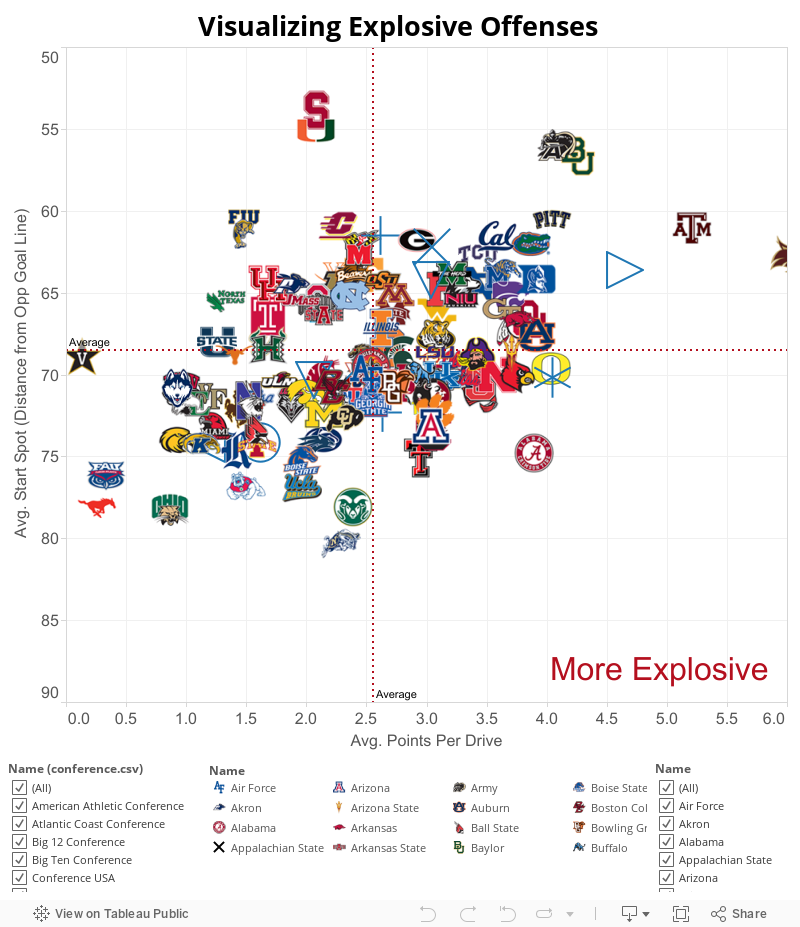
Visualizing Explosive Offenses
In his article "The five factors: College football's most important stats" Football Study Hall's Bill Connelly proposes that explosiveness was one of the most important statistics in college football. Connelly defined explosiveness as Equivalent Points per Play and showed how winning this battle was highly correlated to winning the game.
I think there is another way to look at explosiveness.
Charting average points per drive and average drive starting position yields a chart that illustrates the relationship between the two.
On the vertical (Y) axis I plotted Average Starting Position per Drive. This is the average distance from the opponent's goal line, so a smaller number is better.
On the horizontal (X) axis I plotted Average Points per Drive. For this measure, larger is of course better.
The quadrants can be interpreted this way: Teams in the lower right had, on average, further to go to score and averaged more points per drive than the rest of the FBS. Essentially, those teams did more with less and did it more frequently.
Teams in the upper left quadrant had a more favorable starting position but failed to capitalize on that advantage, scoring on average less points per drive than the FBS.
Teams in the upper right had better than average field position AND turned it into points. Your 70-80 point scoring explosions are probably located here. Teams in the lower left had worse than average starting field position and didn't score much either. Teams in these two quadrants essentially did what would be expected of them. They scored or didn't score based on their field position.
Ideally, teams would want to be in the upper right...scoring frequently because you won the field position battle is always preferable, but the lower right is good too as it means a team has the ability to eat up large chunks of yards quickly.
Wednesday, September 3, 2014
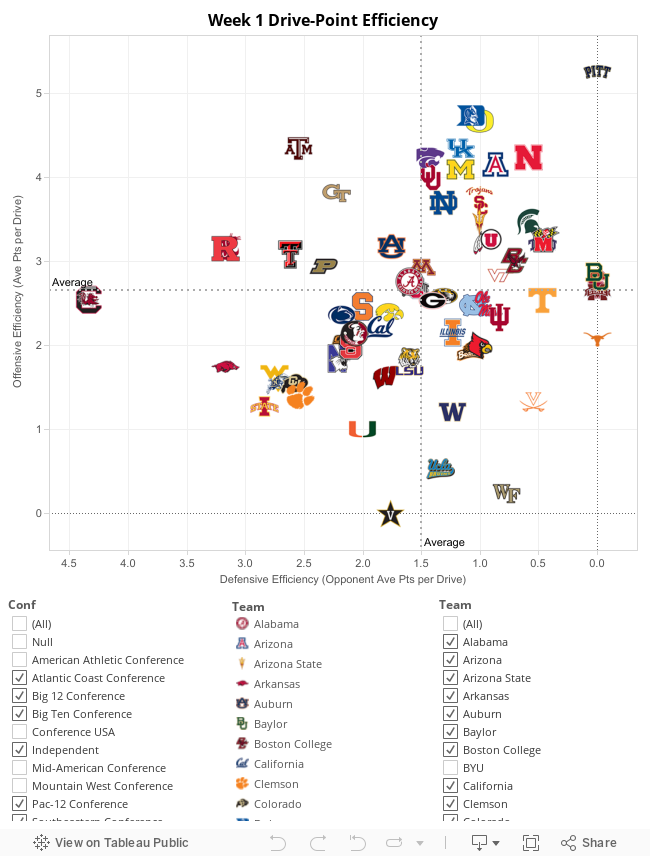
Week 1 Drive-Point Efficiency Report
Week 1 of the 2014 season is in the bag. It's still early, and there will be a lot more regressing to the mean happening in the next weeks as teams' statistical performances begin to more closely portray their true strengths. Until then, though, enjoy the wacky world of early season statistics.
Subscribe to:
Posts (Atom)