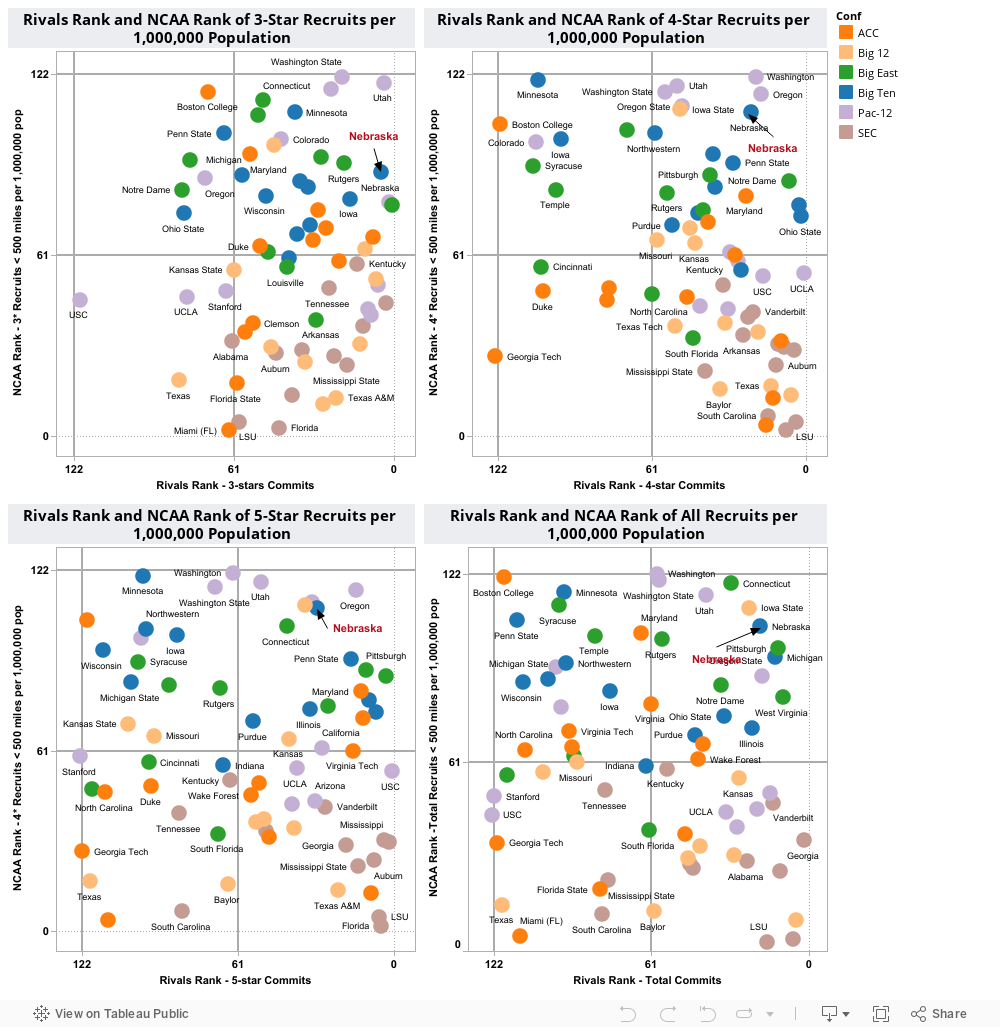
For this analysis, recruit density is the number of Rivals recruits of a given star level located within 500 miles of a given school, normalized to number of recruits per 1,000,000 population. Density rank is a 1-122 rank of the density at each measurement level.
The quadrants, starting in the upper left and rotating clockwise, are:
1. Low Rivals Rank and Low Recruit Density
2. High Rivals Rank and Low Recruit Density
3. High Rivals Rank and High Recruit Density
4. Low Rivals Rank and High Recruit Density.
One can think of the relationship as signifying the degree to which a school overcomes distance and population barriers to pull in talented recruits. Starting from lower left to upper right, moving up and to the right implies that a school is doing better at overcoming these barriers.
No comments:
Post a Comment