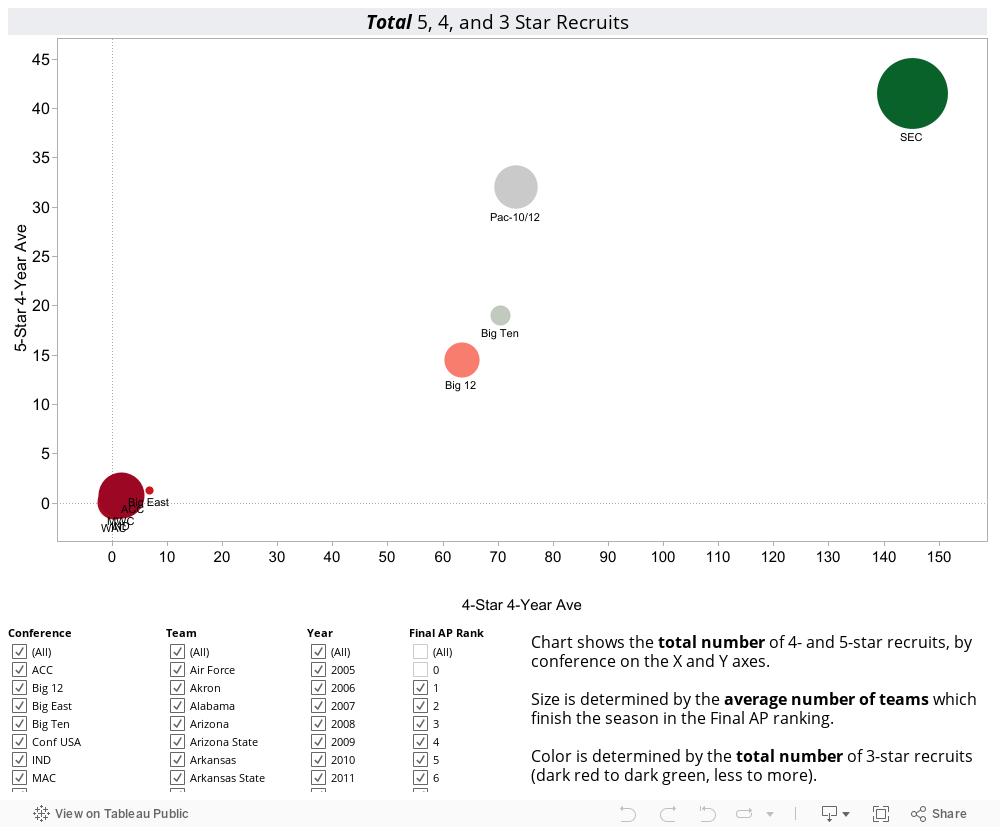
Here are two similar infographics. Each portrays 5-, 4-, and 3- star recruits, by conference, from 2005 to 2012. The numbers of recruits are all 4-year moving averages, meaning the data reported for 2007 is an average of 2004-2007. You see 40-star recruits on the X-axis, and 5-star recruits on the Y-axis. The color is determined by the number of 3-star recruits, dark red (less) to dark green (more). Finally, the size of each circle is the average final AP ranking of the teams in the conference. Unranked teams have a ranking of zero, so they are filtered out. It's not surprise that the SEC dominates the recruiting world, but this chart, which show the total numbers of highly prized recruits, illustrates that very clearly. The SEC's positions in the upper right corner indicates that as a conference, the teams in the SEC which finished ranked in the AP Top-25 signed nearly twice as many 4-star recruits as any other conference and 30% more 5-star recruits. The dark green color of the SEC circle also shows that they landed the most 3-star recruits. Finally, the size of the SEC circle indicates the number of teams which finished ranked in the AP Top 25 was better than any other conference.
This is a pretty clear picture of where prized recruits have gone for the last decade or so. But it doesn't tell the whole story.
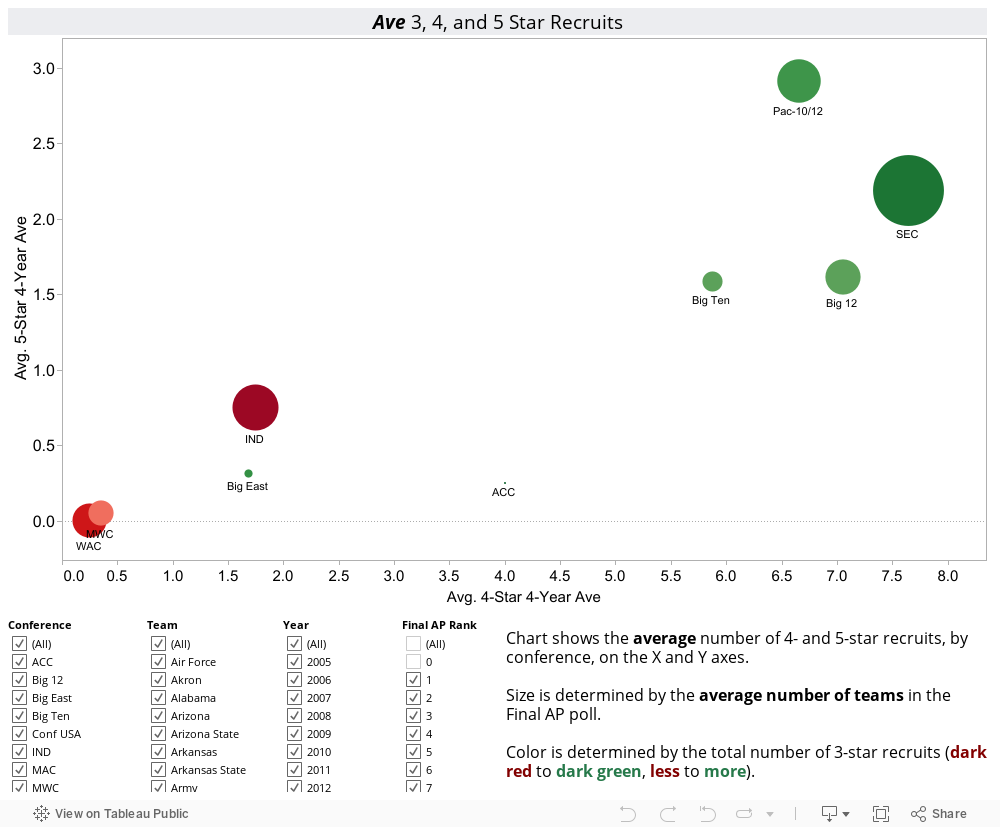
The next infographic, which presents the same data as an average for each conference team, seems to indicate that the per team average for the SEC isn't as well distributed as it is for some other conferences. One possible reason for the difference in appearance between the graphs is that the talent, while significant, in the SEC is more concentrated on a few elite teams, while in the Pac 10/12 it is more spread around. I haven't fully investigated this yet, but I will.
Another thing that jumps out at me is the wide disparity in average number of 4-star and 3-star recruits between the Big Four conferences (SEC, Pac10/12, Big12, and B1G) and the rest of college football. There's simply no middle ground on 4-stars. And the dark greens of those Big Four conferences contrast well with the other teams, indicating an advantage in the number of three stars as well. The data for this analysis is available for download from my public dropbox account.
No comments:
Post a Comment