Intro
There are myriad ways to compare the 5-year dynasties that Nebraska and Alabama have put together. Some indicate Nebraska’s was more impressive, others indicate that Alabama’s was moreso. This is my attempt to compare the two using defensible statistical analysis. It is not the final word on this issue; I’m doing it simply to attempt to get at the question of who accomplished more during their 5-year run.
I organized the analysis along offense, defense, margin of victory, win-loss record, and strength of schedule.
Where I state that there is sufficient evidence to conclude 'X', the statement is based on standard hypothesis testing (t-tests) and evaluated at the alpha=.10 level of significance. The conclusions I draw regarding win/loss records and the overall conclusions are subjective and not based on hypothesis testing.
Where I state that there is sufficient evidence to conclude 'X', the statement is based on standard hypothesis testing (t-tests) and evaluated at the alpha=.10 level of significance. The conclusions I draw regarding win/loss records and the overall conclusions are subjective and not based on hypothesis testing.
Offense 1
This first chart illustrates the average points that Nebraska and Alabama scored when you categorize opponents by end of season ranking. For
simplicity sake, I used the end of season
Congrove Composite Index. Using the end
of season ranking is better because it’s actually available and goes a long way towards to identifying
teams that were ranked at one point in the season but should not have
been or
who were unranked or lower ranked but proved to be better that season.
The number next to each point on the graph is the number of games Nebraska and Alabama played against teams of that rank.
The number next to each point on the graph is the number of games Nebraska and Alabama played against teams of that rank.
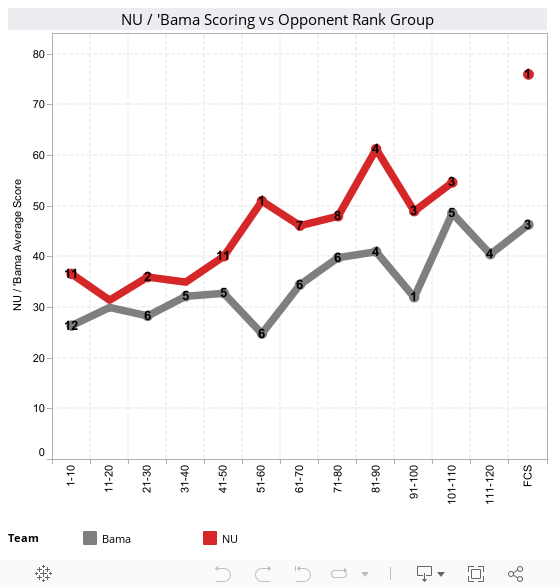
As you would expect, as the opponents’ rank goes down, the
average score that Nebraska and Alabama scored climbs. For opponents of all ranks, Nebraska’s average points scored is
markedly higher. For all ranks, the
average Nebraska score is 42.82 and the average Alabama score is 33.84. There is sufficient evidence to conclude that Nebraska's offense was superior to Alabama's.
Offense 2
This next chart compares Nebraska and Alabama scoring as a percentage of the average scoring allowed by their opponents. While this is much the same as the chart above, it factors in the additional information of their opponent's defenses. Obviously, if Nebraska's average scoring difference came because it played a 5-year slate of defensive duds then the argument that Nebraska scores more points is suspect.
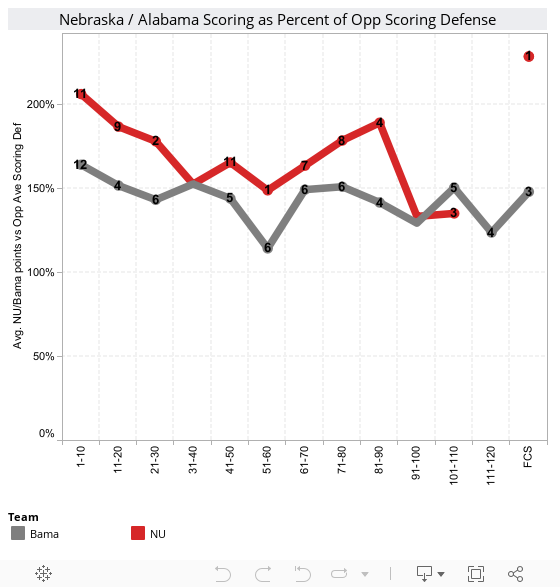
Considering Nebraska and Alabama scoring as a percentage of their
opponents’ scoring defense, one would expect that the percentage would remain
basically steady, or show a slight increase as the rank of an opponent
decreases. This, however, does not seem
to be the case. If anything, there is a slight
negative correlation between percentage scored and opponent rank. It’s difficult to say why this is the case,
but I would speculate that it’s because 150% of an opponent ranked 1-10 is, in
real points, much less than 150% of an opponent ranked 100-110. These games would be the times that 3rd
and 4th string is played, which sometimes leads to offensive
mistakes and ‘garbage time’ points for the opponent.
The flatter trend of the Alabama line may indicate that Alabama as more consistent on offense than Nebraska over the
five years. While they did not put up
the sheer number of points that Nebraska did, their offensive production was remarkably
steady. Nebraska, on the other, was less
consistent, and their performance against teams ranked 101-110 actually
underperformed Alabama’s comparably ranked opponents. This notwithstanding, there is sufficient evidence to conclude that NU's offense was superior to Alabama's.
Margin of Victory
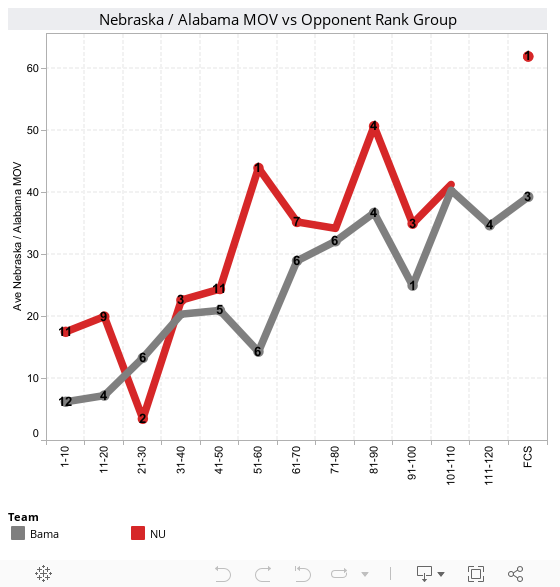
As one would expect, the average margin of victory by Nebraska and Alabama increases as their opponents’ rank decreases. Both show a steady and reasonably linear relationship between average margin of victory and opponent rank. The exception is Nebraska’s average margin of victory against opponent’s ranked 21-30. This is because there are only two games here, and Nebraska lost one of them, leading to a much smaller average.
Generally, we can state that both teams did what great teams as supposed to do…they consistently beat other teams up. As their opponents’ rank decreases, those beatings are more severe. It’s worth noting that Nebraska's average margin of victory against teams ranked 1-10 was 2.5 times that of Alabama’s (17.5 vs 6.3). Against teams ranked 11-20, Nebraska’s average margin of victory as almost three times that of Alabama, (20.0 vs 7.3). For opponents of all ranks, Nebraska’s average margin of victory was 28.2 points and Alabama's was 22.0 points. There is sufficient evidence to conclude that Nebraska had a greater average margin of victory than Alabama.
Defense 1
This next chart illustrates a very similar comparison to Offense 1, but it compares the defenses that Nebraska and Alabama put on the field by measuring the average opponent score, again broken down by end of season rank. As above, the numbers on the chart indicate the number of teams Nebraska and Alabama played in that rank group.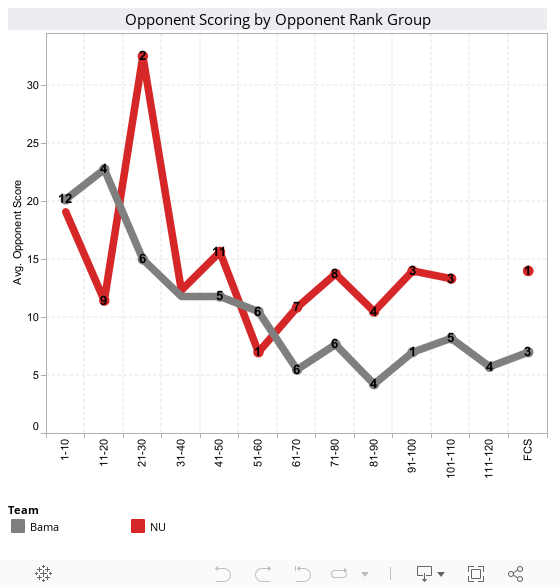
For teams ranked in the top-10, the difference in scoring defense is small. For Nebraska, it’s 18.2, for Alabama it’s 20.2. For most other opponent rank categories Alabama as a slight performance advantage, ranging from about 3-7 points. For opponents of all ranks, Nebraska's opponents averaged 14.41 points and Alabama’s averaged 11.82 points. There is insufficient evidence to to identify defense as better than the other over the entire five years.
Defense 2
The data points illustrated in the next chart are the average opponents’ score as a percentage of Nebraska and Alabama season scoring defense. A lower percentage indicates a better performance for Nebraska and Alabama .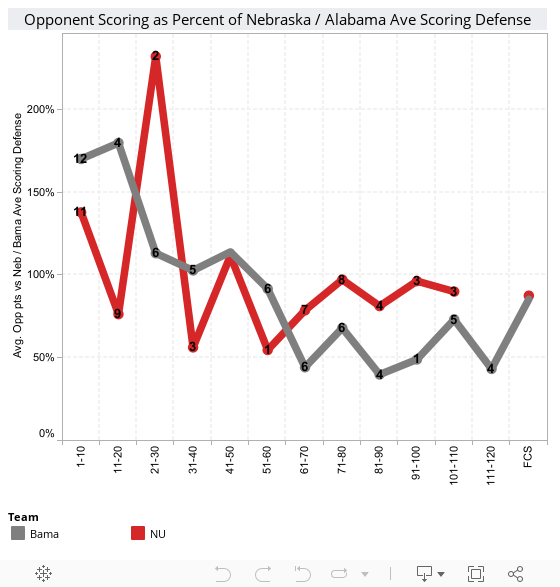
At first blush, I would have expected there to be a negative correlation between the average percentage score by an opponent and the opponent’s rank…better opponents should do better offensively against Nebraska and Alabama than crummy opponents should. Both teams’ opponent scoring shows this general trend, with a decreasing effect as the quality of opponent decreases. This might be explained by the fact that games against far inferior opponents present opportunities to play the 3rd and 4th string, often meaning the opponent has opportunities to score that would not have otherwise been presented had the starters remained in the game.
Nebraska’s defensive performance shows no obvious correlation between rank and opponent points. Alabama, shows a strong negative correlation between Opponent rank and the percent of scoring they allowed their opponents. In other words, Alabama held inferior opponents to well under their season scoring offense average but gave up points to highly ranked teams.
For opponents of all ranks, Nebraska’s opponents' average score as a percentage of NU’s scoring defense was 102%. Alabama’s opponents' average score as a percentage of Alabama’s scoring defense was 101%. As with Defense 1, there is insufficient evidence to conclude that one defense is better than the other.
Wins and Losses
This one is simple: Nebraska had a better overall win-loss record (95.2% vs 89.6%) and a much better winning percentage versus top-20 teams (95% vs 83%). Nebraska also had three undefeated seasons while Alabama had one defeated season. Only twice did Nebraska's winning percentage dip to 92% for the season (’93 and ’96). Alabama had four seasons at or below 92% (’08-86%, ’10-75%, and ’11-92%).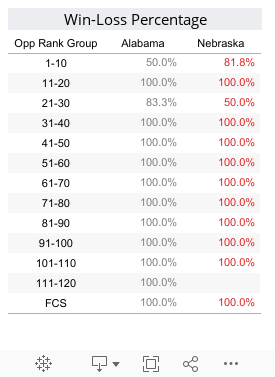
For Alabama , six of their seven losses (86%) were to teams ranked 1-20 (UF-2008-#1, Utah-2008-#4, Auburn-2010-#2, LSU-2011-#2, LSU-2010-#11, and A&M-2012-#5) while two of Nebraska’s three losses (67%) were in the top 20 (FSU-1993-#1, ASU-1996-#4). Alabama and Nebraska both lost to one team ranked 21-30 (South Carolina-2010-#27 and Texas-2006-#25)
Looking at where losses occurred, Alabama lost three at home, two in Bowl/CCGs, and two away. Nebraska lost zero at home, one away, and two in Bowl/CCGs.).
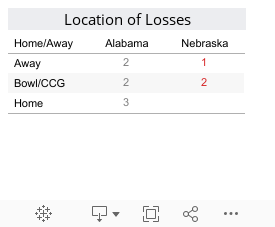
Though it is a subjective assessment, NU's three undefeated seasons, zero home losses, and the same number of bowl and conference championship game losses is sufficient to conclude that NU's win-loss record is better than Alabama's.
Strength of Schedule
Considering the season average rank of Nebraska’s and Alabama’s opponents, Nebraska’s opponent's five year season average is 48.29 and Alabama’s is 53.82. There is sufficient evidence to conclude that NU’s average season opponent ranking was more difficult than Alabama’s. It follows, therefore, that Nebraska’s dynasty was established during seasons of greater difficulty than Alabama’s.
Conclusion
Nebraska was better on offense; neither team demonstrated a clear superiority in defense; and Nebraska had a better win-loss record and a stronger average strength of schedule.I'll allow my readers to make the final conclusions. Who has the best 5-year dynasty?
No comments:
Post a Comment