Distance (to go)
 Looking at the entire football field, the breakdown of fumbles by down and distance looks like this (fumbles on kickoffs and punts are excluded):
1st and 10 accounts for the overwhelming majority of fumbles, but it accounts for the lion's share of the down-distance pairings during a game, so there's nothing particularly surprising in that.
For distances of 10 or greater, 12% of fumbles occur on 2nd down, 5% on 3rd down, and less than 1% on 4th down.
For distances of fewer than 10 yards, 2nd down accounts for 21%, 3rd down accounts for 17%, and 4th down accounts for 3% of fumbles.
Because the fumble percentages correspond closely to the actual play distribution by distance to go in a football game I'm led to conclude that distance to go is not a significant contributing factor to the probability of a fumble occurring on a play.
Because the fumble percentages correspond closely to the actual play distribution by distance to go in a football game I'm led to conclude that distance to go is not a significant contributing factor to the probability of a fumble occurring on a play.
Player Position
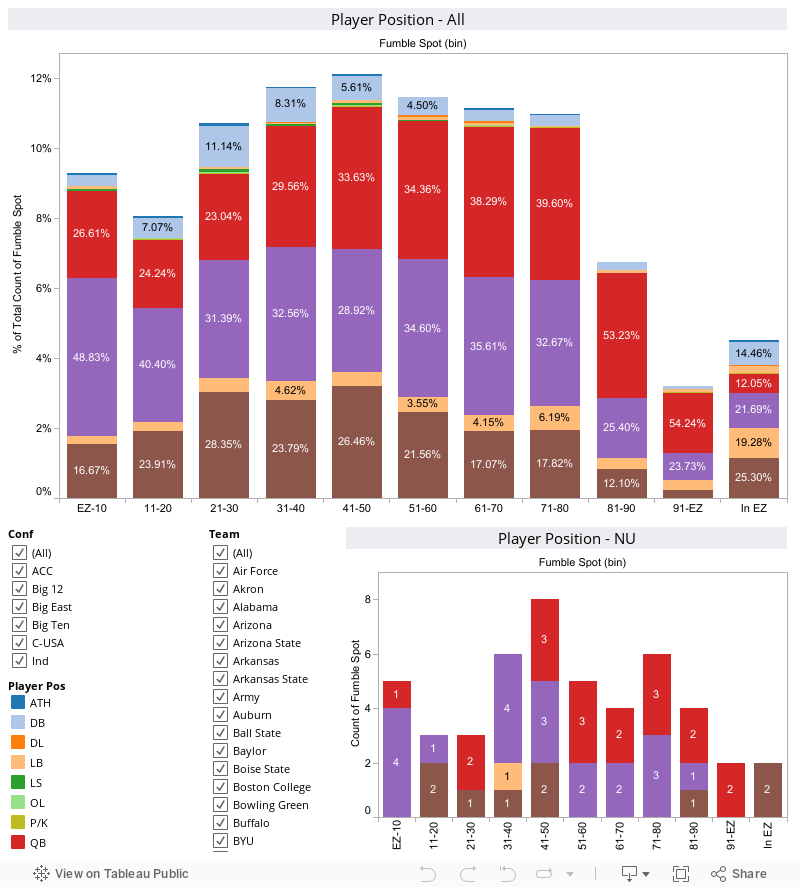
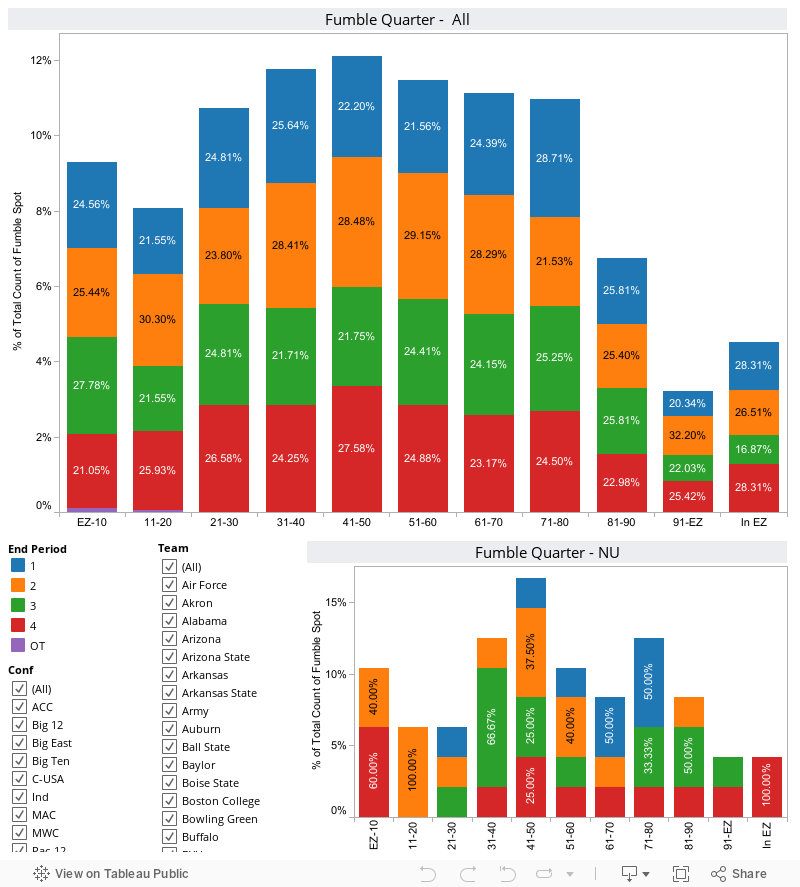
When I look at this chart, absolutely nothing important jumps out at me. While there is some variation in frequency of fumbles between quarters, there's no reason to think that it is due to any reason other than chance.
Conclusion
And this concludes my breakdown of fumbles. If there's a useful takeaway from Parts 1 and 2, I think it is the improbable frequency of fumbles on punt returns.
Follow @HuskerMathTweet
No comments:
Post a Comment