However, with a little digging I was able to come up with some more specific data on fumbles from 2010-2012 that helps place fumbles into a better context within the space and time of the game.
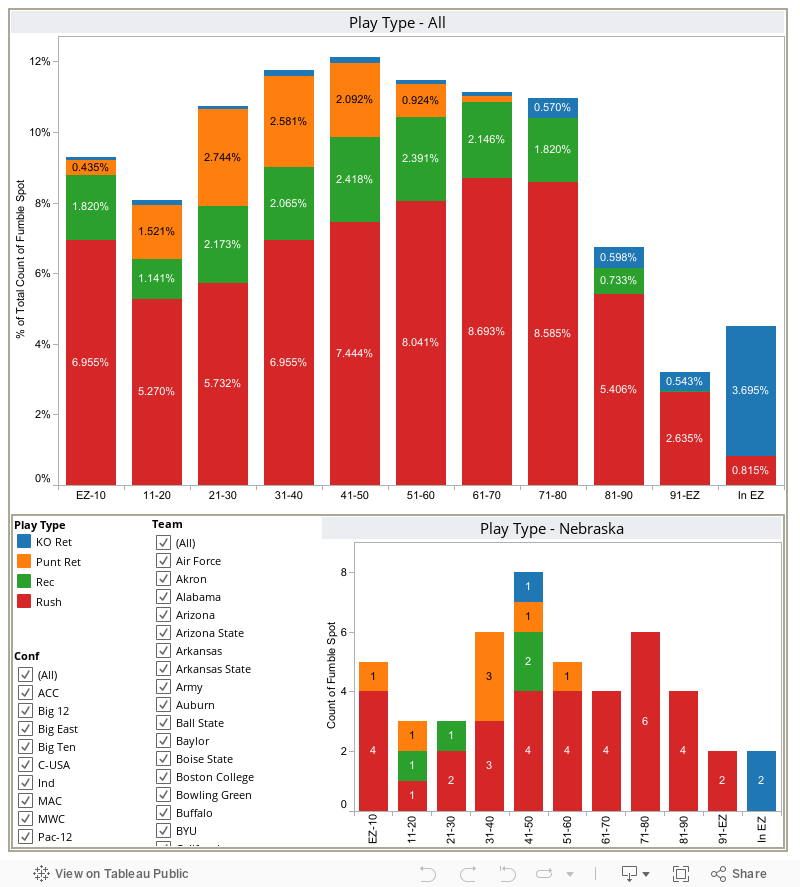
First, let's look at the types of plays that teams were running when fumbles occurred. There are really only four kinds of plays that can result in a fumble: rush (duh), reception, KO returns, and punt returns.
UPDATE - 2PM, 6 March
When I first wrote this analysis I failed to break down the actual number of plays (all plays) for each down. Because of that, I may have drawn exactly the wrong conclusion about fumbles by down.
First down accounts for 38.4% of all FBS plays, but only 33% of fumbles. That means that 1st down is actually the safest down when it comes to fumbles, rather than the most dangerous as I assessed yesterday. Third down is slightly more dangerous, but the real fumble danger zone is 4th downs and punt returns. Fumbles occur on 4th down and punt returns almost twice as often as they should if they occurred at the same frequency as the plays are run.
| Down | NCAA Fum | All NCAA Plays |
|---|---|---|
1
|
32.95%
|
38.42%
|
2
|
27.60%
|
28.73%
|
3
|
19.59%
|
17.96%
|
4
|
3.12%
|
1.88%
|
P
|
13.61%
|
6.16%
|
K
|
6.25%
|
6.85%
|
Grand Total
|
100.00%
|
100.00%
|
Using the methodology to calculated a 'lost points' value for turnovers I proposed in this post, the average 'lost points' for each play type looks like this:
| Fumble Play | Ave Lost Points |
|---|---|
| KO Ret | -6.14 |
| Punt Ret | -5.6 |
| Rec | -5.71 |
| Rush | -5.73 |
| Overall Ave | -5.74 |
While the other play types have nearly identical average values, KO returns are different, and cost more on average.
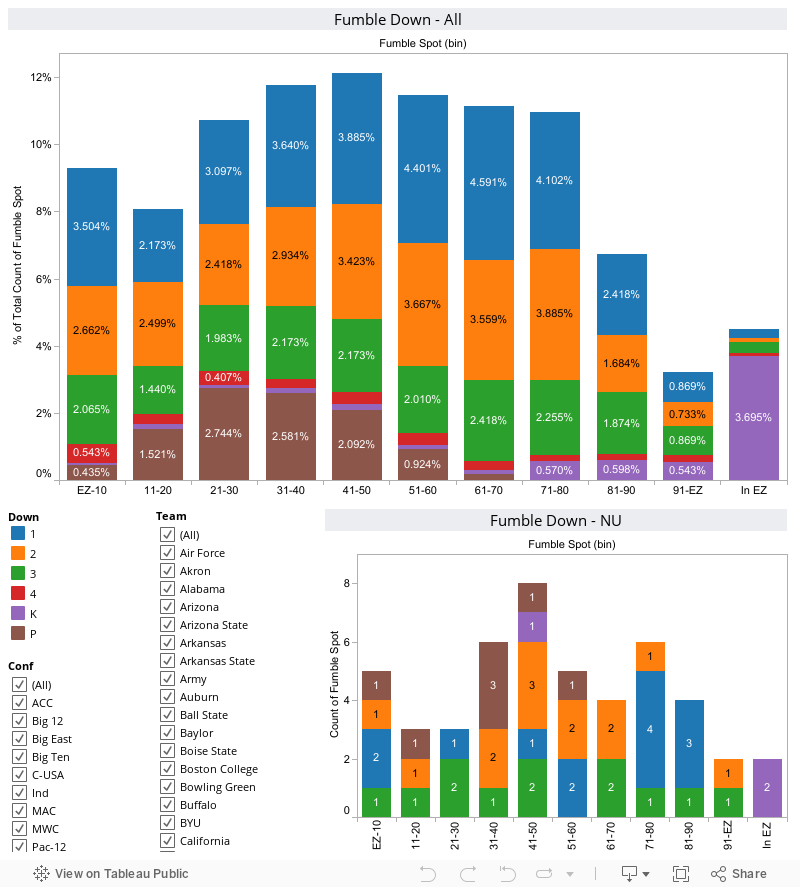
This can be accounted for somewhat by greater number of 1st and 2nd downs in a game, but I don't think that is enough to account for the entire difference. Something appears to be happening here. Does knowing that you have a fresh set of downs lend itself to a false sense of security? Are coaches calling riskier plays on 1st and 2nd downs? I don't know the answer, but it's worth looking into I think.
When I compare NU's by-frequency to the NCAA's, I see this:
| Down | NCAA % | NU % |
|---|---|---|
1
|
32.95%
|
27.08%
|
2
|
27.60%
|
27.08%
|
3
|
19.59%
|
25.00%
|
4
|
3.12%
| |
K
|
6.25%
|
6.25%
|
P
|
10.49%
|
14.58%
|
Stay tuned for Part 2 where I'll break down fumbles by Distance-To-Go, Player Position, and Game Quarter.
GBR!
As always, you can download the data supporting my analyses.
Wow, great work. Thanks so much for doing it!
ReplyDeleteReally great stuff. Just what I want to see! Thanks so much!
ReplyDeleteAfter all of that it means really nothing...You still cannot prevent these kind of mistakes, and you surely will never be able to look at these graphs and charts, and decide before the next play "the fumbles a coming, better tell so and so to hang on to the ball".....Pretty much a big ole waste of time.....
ReplyDelete